Football Months (Betting School Article)

Another Betting School article. This time one I originally wrote in January 2010. It talks about the coming months in the season so should still be a good read and valuable.

Football Months

We are now in the new year and the fresh start gives us a chance to look ahead to the rest of the season. Most leagues they have passed the half way point in terms of matches but there is still plenty to come and lots to be decided. In January and February teams are still jostling for position and trying to move up the table but as the season nears the finish some games mean a lot and other games are meaningless.

The aim of this article is to look at the changes that occur over the course of a football season and see if there are any profitable angles

The data I use comes from www.football-data.co.uk and spans 5 seasons from 05-06 to 09-10 for the top leagues in Germany, England, France, Italy and Spain.

When looking at data over time charts come into their own and there is no better way to see patterns. The first areas to look at are goals scored and then shots taken as they go together.

image001image002

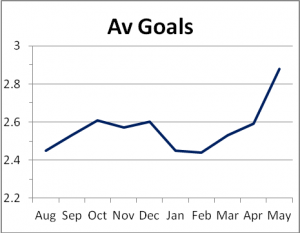
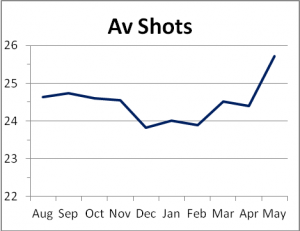
Looking at the above you can see some similarities and obvious patterns. At the start of the season the goals are pretty low. However, the number of shots is not lower and so it may be that players take a while to get into the groove and so the early season dip in goals is to do with a bit of rustiness. Then come the months of January and February where there is a clear drop in both the number of goals and number of shots. I can think of no explanation for the drop in shots unless poor pitches and cold weather plays a part. The final part of the season sees a clear increase in both shots and goals possibly down to a lot of teams having little to play for. This brings a more carefree attitude and teams may concede and score more goals as there is less pressure.

As we can see a pattern here the best market to exploit it might be the over under 2.5 market. If we look at percentage of matches under 2.5 goals we hope to see the same pattern again. The big question is do the bookmakers also know that this pattern exists? By charting the average price of under 2.5 goals we should be able to see just that.

image004image003

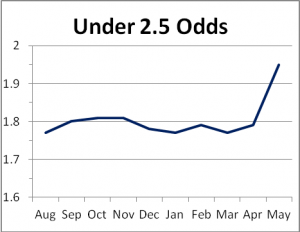
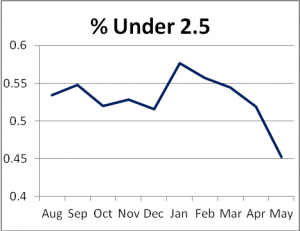
Although the under 2.5 graph is reversed you can see the same pattern exists in January and February with those 2 months having the highest averages of the season. If we look at the odds for the bookmakers (I have used BbAv<2.5 = Betbrain average under 2.5 goals) we can see a minor drop but nothing like we have seen in any of the other charts. The bookmakers have the climb at the end of the season spot on but there could be a bit of profit to be taken in the months of January and February.

The reason I chose the under market is that it is more profitable than the overs market.  You can see this in the following table as well as a complete breakdown by month for over and under 2.5 results. Again this uses the Betbrain average over and under 2.5 goals price from football-data.co.uk.

Month

Matches

% Over 2.5

Over P/L

Over ROI

% Under 2.5

Under P/L

Under ROI

Aug

627

46.6%

-44.48

-7.1%

53.4%

-42.59

-6.8%

Sep

903

45.2%

-116.22

-12.9%

54.8%

-28.25

-3.1%

Oct

938

48.0%

-71.16

-7.6%

52.0%

-72.57

-7.7%

Nov

916

47.2%

-85.82

-9.4%

52.8%

-60.13

-6.6%

Dec

971

48.4%

-49.46

-5.1%

51.6%

-86.74

-8.9%

Jan

836

42.3%

-143.62

-17.2%

57.7%

5.91

0.7%

Feb

976

44.3%

-130.25

-13.3%

55.7%

-18.01

-1.8%

Mar

1018

45.6%

-102.08

-10.0%

54.4%

-51.02

-5.0%

Apr

1088

48.1%

-60.11

-5.5%

51.9%

-90.32

-8.3%

May

827

54.8%

-5.15

-0.6%

45.2%

-111.96

-13.5%

Total

9100

47.0%

-808.35

-8.9%

53.0%

-555.68

-6.1%

What stands out to me here immediately is that backing all games under 2.5 in January returned a profit and doing the same in February just returns a very small loss. If we had used the maximum odds then those two months combined return an 80pt profit and a ROI of 4.5%.

The other point is that even though the bookies expect more goals in May you can still do well backing overs. Looking at the maximum odds a profit is attainable for this month backing every game as over 2.5 goals.

I think it’s worth digging a little deeper into the January and February under 2.5 results to see if we can find more profitable angles. Maybe some leagues may be better than others so that is a starting point.

Month

Country

Matches

% Under 2.5

Under P/L

Under ROI

Jan

Germany

61

47.5%

-3.32

-5.4%

Feb

Germany

189

48.7%

-4.59

-2.4%

Jan

England

183

57.4%

5.34

2.9%

Feb

England

170

58.2%

3.45

2.0%

Jan

France

172

69.2%

15.14

8.8%

Feb

France

192

58.9%

-14.89

-7.8%

Jan

Italy

207

53.1%

-12.21

-5.9%

Feb

Italy

225

58.2%

6.65

3.0%

Jan

Spain

213

55.9%

0.96

0.5%

Feb

Spain

200

54.5%

-8.63

-4.3%

Very interesting that the Premier League is the only league to show a profit for both months. Serie A and the Bundesliga are the only two leagues not showing a profit in January and that does look a better month to concentrate on. In February, aside from England, Italy is the only country that shows a profit. If we stick with the Premier League in January we’ll see if it’s possible to improve the figures using a rule. If we exclude any match featuring one of the big 3 of Arsenal, Chelsea and Manchester United we get these results

Month

Matches

% Under 2.5

Under P/L

Under ROI

Jan

131

61.1%

16.73

12.8%

Feb

121

59.5%

7.64

6.3%

Normally I would include Liverpool in the big 4 but with their current situation and the poor time they had last season I thought it sensible to stick with a consistent 3 and they make little difference to the results either way. So a simple system of backing under 2.5 goals for Premier League matches in January when one of the big 3 is not playing returns a very nice profit.

It makes sense to look at some other statistics now and see if patterns exist. There is data for corners and cards but sadly no data for the odds so we cannot search for profitable angles but merely speculate.

image005

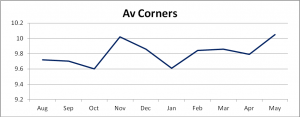
January again features as the lowest month along with October. I am not sure whay October appears but the drop in January would fit with what we found earlier with less shots. I would assume less shots would contribute to a lower corner count. With corners not being a totally mainstream market there could well be opportunities going lower in January. As in all the charts we see the peak towards the end of the season.

The last area to look at is cards.

image006image007

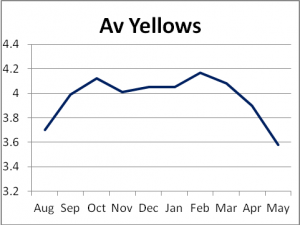
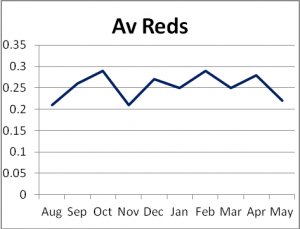
With the yellow cards there is a clear pattern at the start and end of the season of less cards but from October to March it all looks pretty steady. Refs probably start the season trying to be more lenient or maybe firmer pitches then and at the end of the season play a part. Again I would imagine the bookies may be aware of the lower card counts at the end of the season but the drop is quite considerable and they may not judge it correctly. In terms of red cards there is a drop in November which seems a bit out of character and if we ignore that then the red cards would show a similar pattern to the yellows.

Overall it looks like there are a few distinct sections to a season and we are in the midst of one now in January and February to come. The league may not be decided in these months but the games are very important as everyone still has something to play for. We can expect less goals and less corners it seems as well. Then when we get to May we should see more patterns emerging like more shots, more goals, more corners and less cards.  Further research may be needed to see how the end of season stats are affected by teams playing for nothing or those at the top and bottom of the table.

Leon Pidgeon

Hit or Myth: Does a new manager make his point or points! (Betting School Article)

This is an article I originally wrote for the Betting School in November 2011. Some of the content should be worthwhile despite some of the data being slightly old.


Hit or Myth: Does a new manager make his point or points!

You have to love some of the football myths. I remember being asked which player had won the league title with Arsenal and been involved in the Munich air disaster. The answer I was  informed was John Lukic as his mum had been aboard the plane when pregnant and survived the disaster. This is absolute tosh as he was born nearly 3 years after the air crash and was based on the fact that Harry Gregg saved a woman called Mrs Lukic during the disaster who was pregnant.

Thankfully the advent of the internet means it is a lot easier to check this kind of thing and not embarrass yourself with some made up trivia which I have been guilty in the past. My brother in law likes to remind me of some dodgy trivia question I asked him about Imre Varadi and the teams he had played for which he was able to expose as rubbish and declare my knowledge as ‘bobbins’.

This month I want to look at how teams perform with a new manager. Often when a new manager arrives the perception is that the results will pick up as players try to impress the manager. This is the theory I will try to test this by looking at how teams perform in the games before and after the manager arrives to see if there are any profits to be had. I have decided to look at 4 games either side of the appointment. The reason I have chosen 4 games is then we should get two home and two away matches for each team to give a balanced result set.

I am looking at the English Leagues and have taken the information about managers leaving their jobs from the League Managers Association website which has a lot of data for this.

According the league managers association there have been, on average, just over 50 managerial changes in each of the last 5 seasons as shown below.

League

2006-07

2007-08

2008-09

2009-10

2010-11

Barclays Premier League

12

12

14

6

10

npower Championship

11

13

13

19

15

npower League One

13

12

14

12

17

npower League Two

13

9

9

13

16

Total

49

46

50

50

58

I wanted to be able to exclude any changes that happened in the off-season so to do this I only included matches where the next match after hiring was within 14 days and the last match before a firing was within 14 days. Also I have excluded any changes where the new manager was not in place within 30 days of the initial manager leaving. This leaves us with 129 managerial changes over the 5 years.

I have seen some analysis of this kind of thing before and I was expecting to confirm this as a myth but the results are quite surprising. The first thing to look at us how many matches the teams won in the 4 games before and after the managerial change.

Wins

Games

Win %

4 games before

37

129

29%

3 games before

37

129

29%

2 games before

26

129

20%

1 game before

17

129

13%

1 game after

34

129

26%

2 games after

52

129

40%

3 games after

45

129

35%

4 games after

45

129

35%

You can see the win percentage fall as we get closer to the dismissal and then it picks up in the first game but then makes much bigger jumps in the 3 games after. Taking all 4 games together this equates to a 23% win percentage in the period leading up to the change and then a 34% win percentage afterwards.

Another thing to notice is that it is invariably a bad result that triggers the sacking as there is just a 13% win percentage in the game before a sacking. This is not rocket science but with the number of markets available to bet on for managers being sacked it could help.

After seeing the results the next question that needs to be asked is can we profit from this and the answer looks to be yes if we look past the opening match.

Win %

P/L

4 games before

29%

-33.99

3 games before

29%

-31.69

2 games before

20%

-53.66

1 game before

13%

-76.61

1 game after

26%

-15.75

2 games after

40%

24.54

3 games after

35%

8.12

4 games after

35%

-0.28

The second and third game after the managerial change look to be the key games for getting a profit and there is some logic to this. In the first game the manager cannot change very much and sometimes is even just watching from the stands. I also believe in this game the prices reflect the fact that bookmakers expect some improvement. In the second and third game the manager has been able to work with the players and get across any new methods/tactics etc. In the fourth game the win percentage is the same as the third game but no doubt the fact that the team has improved will mean the bookmakers will adjust their prices to be lower and so the profit is eradicated.

I must that admit when I chose this choice of topic I firmly had the idea in my head it was going to be a myth but now it is time to dig deeper and see if we can find any more profitable angles.

Looking at the 129 changes the only manager that was able to produce 4 wins out of 4 was Guus Hiddink when he took over from Big Phil at Chelsea. Maybe there could be some scope in looking at the results by division.

Profit/Loss

Barclays Premier League

npower Championship

npower League One

npower League Two

Conference

4 games before

-10.66

-17.47

-6.26

-1.15

1.55

3 games before

-10.76

-19.42

0.09

-0.17

1.57

2 games before

-21.88

-19.84

-10.74

-8.95

-3

1 game before

-23.86

-26.19

-9.62

-16.91

-0.37

1 game after

-2.31

6.54

-10.66

-4.97

-1.35

2 games after

-2.49

13.89

1.52

12.17

2.45

3 games after

-11.11

0.69

15.82

5.6

0.12

4 games after

7.82

-3.68

-8.83

4.85

2.56

This table above shows the raw profit and loss by division. The Premier League still shows a loss for the 4 games after a managerial change. Of the 4 games it is only the fourth one that shows any profit. If we look at the Championship it is the reverse and only the fourth game does not make a profit and overall there are some decent results. League One shows an overall loss for the games after managerial change but the big loss is in the first game after the change which we discussed earlier as probably being no surprise. League Two shows a decent profit for all but the first game in and is the most profitable of the lot. There are not many results for the Conference and it is hard to take anything positive or negative from there. I will remove the Conference from the rest of the results.

If we look at the 4 games post change as a whole in the table below we can now more clearly see the loss in the Premier League and the fact the other Leagues are all quite consistent in terms of win percentage. Why is the Premier League different? My personal take is that in the Premier League has huge gulfs in class and that a poor team is a poor team and no amount of managerial magic can change that. Yes, some teams over perform but by and large most teams play to their own level. In the other divisions maybe the improvement brought about by a manager can make a very big difference.

4 games post managerial change

Barclays Premier League

npower Championship

npower League One

npower League Two

Won

34

56

45

33

Total

112

164

132

96

Win %

30%

34%

34%

34%

Profit/Loss

-8.09

17.44

-2.15

17.65

So now let’s pull all this together and see if we can find a profitable angle. The Premier League looks worth avoiding and also we have seen that the first game does not seem to yield decent results and that by the fourth game any improvement has been spotted by the bookmakers. The results for the second and third game a new manager has in charge of a team are shown below by the 3 lower divisions.

Won

Total

Win %

Profit/Loss

ROI

npower Championship

29

82

35%

14.58

18%

npower League One

28

66

42%

17.34

26%

npower League Two

19

48

40%

17.77

37%

All

76

196

39%

49.69

25%

Some very nice returns in there and with a total of nearly 200 games spanning 5 seasons there is an average of around 40 games per year that would qualify. Something worth looking at for sure and also on the flipside you would not want to oppose a team with a new manager in these games.

The new broom does look to sweep clean in the lower divisions and I would put this one down as a hit for them. In terms of the Premier League I do not think it makes much difference and would not be too concerned with this factor.

If you have any suggestions for any myths to investigate please contact me.

Leon Pidgeon

Goals Galore Article (Betting Insiders April 2011)

This is an article I originally wrote for the Betting School in April 2011. Some of the content should be worthwhile despite some of the data being slightly old.

When both teams score …

In the last few months I have often come across people talking about the Goals Galore coupon with Betfred and the equivalents that other bookmakers offer. For those who are unfamiliar with it the aim is to find matches where both teams score and Betfred pay 9/4 on 2 correct, 9/2 on 3 correct all the way up to 1150/1 for 12 correct for those keen to lose money.

Working with Betting School we have come up with a console that will hopefully help to pinpoint games that are more likely to have both teams score and that is already available to members.

The idea with this article is to search round the both teams to score angle to see what can be found and how the console can be used with these ides. In this article the abbreviation BTS will be used for both teams score/scored/scoring. The data used is from the English Premiership, Championship, Leagues 1 and 2, the Conference and the top league in Scotland, France, Italy and Spain. I have included the results for Germany in a table below and we see why Betfred don’t include it on their coupon.

Some readers may think this is a bit late in the season to be looking at this type of bet but as I showed in the January article as we get to the end of the season the number of goals increases and therefore so does the number of games where BTS. The table below shows the percentage of games where BTS by month.


Month

Matches

BTS

No BTS

% Games where BTS

August

1742

905

837

52%

September

2154

1126

1028

52%

October

2018

1080

938

54%

November

1753

863

890

49%

December

2214

1110

1104

50%

January

1922

957

965

50%

February

2040

977

1063

48%

March

2376

1167

1209

49%

April

2417

1226

1191

51%

May

966

521

445

54%

You can see that the start and end of the seasons look the best times for attacking this angle and overall in 50.7% of matches BTS. Therefore the chance of getting a double with two random games is 1 in 4 which equates to 3/1 and so Betfred only offering 9/4 mean we need to find more angles. To get to a break even situation we need to find games where the chance of BTS is between 55-56%. If we find games where the chance is 56% the decimal odds should be 3.19 on the double but Betfred are offering 3.25 (9/4) so we get value.

If we break the statistics down by the individual leagues we can see if some are better for concentrating on than others.


Div

Matches

BTS

No BTS

% Games where BTS

Ger Bund

1530

853

677

56%

Eng Champ

2760

1457

1303

53%

Ita Serie A

1900

998

902

53%

Eng Lge 2

2760

1436

1324

52%

Eng Lge 1

2760

1428

1332

52%

Eng Conference

2624

1343

1281

51%

Spa Primera

1900

966

934

51%

Scot Prem

1140

568

572

50%

Eng Prem

1900

903

997

48%

Fra Ligue 1

1900

859

1041

45%

The German league comes out on top and it’s no surprise that this does not feature on the Betfred coupon. The French league is considerably lower than the others and it’s a bit of a surprise to see the Italian league so high up. The 4 English lower leagues also fair well but in any analysis like this I like to look at results with and without the big teams to see if this makes a difference to the results.

The leagues I am using and the clubs I am classifying as big are as follows:

England – Arsenal, Chelsea, Liverpool and Man United

France – Bordeaux, Lyon and Marseille

Italy – Fiorentina. Inter, Juventus, Milan and Roma

Scotland – Rangers and Celtic

Spain – Atletico Madrid, Barcelona, Real Madrid, Sevilla and Villarreal

If we look at matches involving big teams only we some interesting results.


Big Team v Big Team

Matches

BTS

No BTS

% Games where BTS

Eng Prem

60

27

33

45%

Fra Ligue 1

30

22

8

73%

Ita Serie A

92

58

34

63%

Scot Prem

20

8

12

40%

Spa Primera

150

86

64

57%

The two British leagues are the odd ones out in this as all the other leagues have a considerably higher percentage of BTS when it’s just the big teams playing. It is very high in France, and although the sample is very small this would be a pattern I am happy to follow. The same has to be said for Italy where the 63% BTS is well above the 56% threshold we are after.

Normally I would look at games with big teams against non-big teams overall but in this I think it makes sense to break it down depending on who is at home. If we start with games where the big club is at home against a non-big club we get the results below.


Big Team at Home

Matches

BTS

No BTS

% Games where BTS

Eng Prem

324

126

198

39%

Fra Ligue 1

255

123

132

48%

Ita Serie A

364

185

179

51%

Scot Prem

170

75

95

44%

Spa Primera

420

206

214

49%

France is the only league where these results are above the average for all games. I would expect this figure to be lower as you would think these teams are more likely to keep clean sheets. I expect most people would not use these games anyway in their coupon but they can be useful when you look back over a team’s form as you may see a couple of games where both teams did not score, but if this was against a big side it may be worth ignoring it. For example on the console I looked at a Bolton away match and both teams had scored in a healthy 10/15 matches. However, the games when they didn’t were against Manchester United, Manchester City, Chelsea, Sunderland and Stoke. The first 3 teams, along with Arsenal fill the top 4 places in the league and have done most of the season so if we ignore games at the top 4 clubs their record becomes an even healthier 9/11. I would imagine these results also work for lower divisions based on the top sides each season but without testing this cannot say so for sure.

The table below shows when the big team is away.


Big Team Away

Matches

BTS

No BTS

% Games where BTS

Eng Prem

324

144

180

44%

Fra Ligue 1

255

112

143

44%

Ita Serie A

364

188

176

52%

Scot Prem

170

103

67

61%

Spa Primera

420

217

203

52%

Aside from France the results go up compared to the table above. The Scottish result is a particularly high one and any games with an old firm team away could warrant a second look.

Finally we look at games where none of the big teams are playing below.


No Big Team

Matches

BTS

No BTS

% Games where BTS

Eng Prem

1230

623

607

51%

Fra Ligue 1

1360

602

758

44%

Ita Serie A

1080

567

513

53%

Scot Prem

780

382

398

49%

Spa Primera

910

457

453

50%

The Premiership is again an exception here but for all the other leagues we can see that the results for this are more or less equal to the average for all games. Essentially in these games there is nothing outside of norm so we would need to look for patterns with particular teams.

With a bet like this you want to look for teams that follow patterns as they are likely to keep them up. I believe Peterborough and Crewe are often taken off the Goals Galore coupon as they were having BTS so much. Whist writing this article I used the console and saw that Southend host Aldershot on 2nd April and 14/19 Southend home games and 13/19 Aldershot away games had BTS. Both of these teams have a good pattern and would be a decent selection if featured on the coupon.

I looked at individual team patterns a bit more and found some startling results for certain teams over the course of a season. The table below shows 5 teams on either end of the extremes.


Season

Div

Home Team

Matches

Both Scored

One or None

% Games where BTS

06-07

Eng Prem

Man City

19

3

16

16%

07-08

Fra Ligue 1

St Etienne

19

3

16

16%

08-09

Eng Champ

Doncaster

23

5

18

22%

09-10

Eng Conference

AFC Wimbledon

22

5

17

23%

08-09

Eng Lge 1

Southend

23

6

17

26%

09-10

Scot Prem

St Johnstone

19

14

5

74%

07-08

Eng Champ

Colchester

23

18

5

78%

07-08

Eng Conference

Forest Green

23

18

5

78%

08-09

Eng Lge 2

Luton

23

18

5

78%

06-07

Ita Serie A

Atalanta

19

15

4

79%

Some of these values are outstanding but show how some teams get a pattern and stick with it all season. That’s not to say you don’t need to be aware of a change in pattern but hopefully the console will help with that. An example of a change in pattern would be Rotherham this season. At home 8 of their first 10 games had BTS but since then just 2 of the last 8 games have had BTS and what’s interesting is that they have kept scoring but have started to keep clean sheets and so those 6 games in the last 8 were all where they kept a clean sheet.

I hope this will all help with anyone interested in trying to make money from the Goals Galore coupon or similar using the console. The other two sections the console has show over/under goal statistics and also the average shots and shots on target. The over/under section just helps to give an idea of how many goals are being scored by these teams and it is all relevant to the both teams scoring market. In the nearly 20,000 games I have been through the games with both teams scoring average 1.4 shots more than those without. 0.95 of that difference is down to the visiting teams having more shots so finding teams with a better than average number of shots, particularly when away can be another factor that will swing whether to bet or not.

I can be contacted with ideas for improvements for the console, problems or any questions to do with it or anything in my articles.

Leon Pidgeon

Betting School Article

Once a month I write an article for Betting School and this month is no exception. I am doing something based on shots and the idea coming out is that is could be a decent indicator of success. So to test it this weekend I have a few selections that I am putting up. I am putting them up for reference as they are in the article and I want to post them

Bundesliga – Hannover look to be a bit lucky being so high up with so few shots but they are at home to Borussia Monchengladbach who also are poor. Freiburg have had a lot of shots and so have Leverkusen and Hoffenheim could be better off than they are. Sadly Leverkusen and Hoffenheim are away from home and the only possible looks to be Freiburg.


Eredivisie – Roda look to be in a false position as do Waalwijk. Vitesse and Hercales both play at home and look to have less points than their shot ranking deserves. I like them and also Venlo who have just 1 point at home but are ranked in the top half of average shots.


Premier League – West Brom and West Ham look to have been lucky and again Liverpool look to be unlucky! Swansea, Spurs, Arsenal and Villa all look to have less points than their shots deserve. Of these only Villa are at home.


Predictions (Best odds available at 18.05 (CET) on Thursday 25th October)


Freiburg to bt Dortmund @ 6.0 with WH

Vitesse to bt AZ @ 2.18 with Pinnacle

Heracles to bt Heerenveen @ 2.04 with Pinnacle

Venlo to bt NAC Breda @ 2.28 with Pinnacle

Aston Villa to bt Norwaich @ 1.96 with Pinnacle