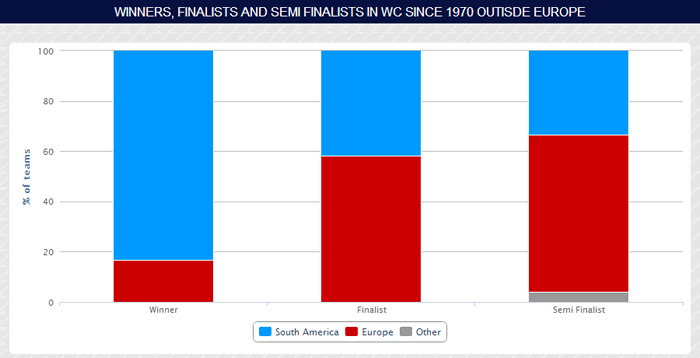
I’m starting to look ahead to the World Cup now and one stat this is likely to be brought out again and again is that European teams have struggled when the World Cup is outside of Europe. Now this is true and when Spain won the World Cup in South Africa it was the first time that a European team have won the tournament away from their home continent.
However, I don’t think this tells the full story as European teams have made the final a number of times and provided the majority of the semi finalists. I looked at the finals going back to 1970 and checked out how the European teams have done. I didn’t go back further than that because I think then you are getting into a whole different world of football and it’s not even in colour!
I prefer a chart to show anything like this and you can see the live version here or just check out the copied image below.
As you can see they may have struggled to win (17%) but they have provided more finalists (58%) than South America and when we get to semi finals then it’s up to 63%. It looks like the European teams have been a little unlucky in those finals?
Argentina in 1978 was the last time that there was more than one South American team in the semi finals and South Korea and Japan in 2002 was the only time since 1978 that Europe did not have three semi-finalists and that was down to some dubious refereeing that allowed South Korea to progress.
On the flipside it can be said that the World Cup has not been in South America since 1978 and that will make all the difference but I think modern players are different. They are used to travelling, staying in hotels and playing in hot weather. All those pre-season tours clocking up miles in the Far East have to have some use.
With Argentina and Brazil at the head of the market at 5/1 and 3/1 respectively surely the value has to be with the European teams in the outrights.


