Stat Analysis 2017-18 season

With the new Premier League season underway, everyone is anxious to forecast where their favorite team will end up. Although it’s still early, many people are beginning to predict the final table. One of the best ways to do this is by using the soccer pythagorean theorem, as described here.

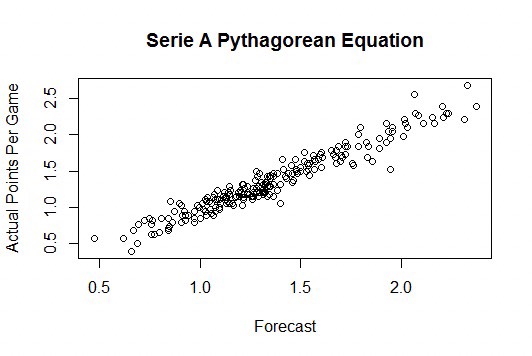
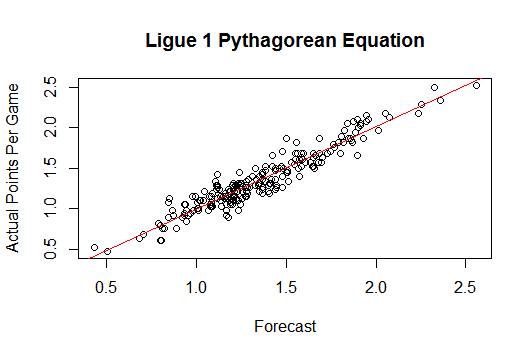
This model essentially uses goals scored and goals conceded to give a team an expected points per game. This can then be used to forecast how a team will fare over the rest of the season. In this article, we are going to go back to the 2017-18 EPL season to analyze the effectiveness of the formula.


In order to do this, we are going to retrospectively perform a mid-season prediction. Basically, we are going to take data from the first 19 games (half the season) of the Premier League, and use that to develop each team’s expected points per game. We will then use the expected points per game value, extrapolate it to the final 19 games of the season, and add that to the initial 19 games, to get a final prediction for the 38 game season.
(If you are curious as to how this whole process works, I suggest reading the previous articles, in which the overall method was outlined)
When this process was performed, I found that, on average, the expected points and final points differed by an average of 4.8 points. That means that this model was able to accurately predict the final standings for each Premier League team with an error of just 0.126 points per game.
In fact, 9 of the teams had expected points and actual points that differed by under 2 points at the end of the season. The model accurately predicted West Ham, Crystal Palace, and Newcastle to climb out of the relegation battle, and also predicted Stoke City’s late struggles.
In this study there were just 6 teams that had a prediction error of 6 points or higher. However, of those teams, 4 of them experienced managerial changes during the season. This would explain the unpredictability of their results, as new staff means new playing styles and new results. When these 3 teams are negated in the study, the average points disparity drops down to just 3.98 points over the course of the entire season.


So, what does this mean for this season? Well, once we get close to a reasonable enough sample size (roughly 10 games, I’d say), we’ll be able to accurately predict the fates of teams in leagues around the world. We’ll be able to judge which teams can stay at the top, which teams will have a late surge, and which teams will be fighting to stay up. It’s an exciting way to track what’s sure to be an exciting season.

Author: Nikhil Mehta

Record Breaking Year for Manchester City?

What a start it’s been for Manchester City, who are currently sitting 8 points ahead of 2nd place Manchester United, despite being only 11 games in. They’ve won 10 of those matches, the only standout being a draw with Everton.

City have already been smashing records, for example,  their 13 game winning streak in all competitions (a new club best). In addition, they’ve also beaten their previous mark with 6 consecutive away wins. Their goal difference of +31 is a Premier League record through 11 games, and they also have a perfect Champions League resume to add to the list.

However, at some point the question has to be asked: Can City break the ultimate record – most points in a Premier League season. The current record is held by Chelsea, who notched 95 points in 2004-05 under Jose Mourinho.

A simple look at this says that if they have 31 points through 11 games, they’ll end with 107 points. That’s a pure linear model. However, the sporting world does not work that way. We have to take into account the idea that Manchester City will likely regress back slightly as the season wears on.


We can model this through the use of our “Pythagorean Theorem” (https://goo.gl/cUiccT). This model takes a team’s goals scored and goals allowed, and uses them to create an expected points per game for that team.

Given Manchester City’s current statistics (which of course will change over the course of the year), they have an expected 2.52 points per game. And with the 27 remaining games in the season, they are projected to obtain another 68 points, which would result in an expected 99 total points at the end of the season.


Given that these projections typically have a RMSE, or error, of 0.1226 points per game, we can expect a +/- error of about 6.6 points at the end of the season. This means we are 95% certain that City will finish with a points total between 92.4 and 105.6. Of course this isn’t great, however, it can also be said that there’s about a 70% chance they will finish between 95.7 and 102.3 points.


Now, we can’t take transfers, injuries, and other unforeseeable events into account, so this is solely based on how they’ve begun their campaign. And so, while nothing is guaranteed, it is likely that we will see Manchester City’s 2017-18 campaign end in a Premier League record. It will be really interesting to see whether the Citizens will achieve this feat, and maybe even go on to reach triple digits.


Author: Nikhil Mehta

Applying the “Pythagorean Expectation” to Soccer

One of the most interesting breakthroughs in the world of sports statistics was Bill James’s creation of the “Pythagorean Expectation”. This module predicts a given baseball team’s win percentage based on their number or runs scored and runs allowed. The basic formula for this is: Predicted Win % = (RS2) / (RS2 + RA2). Recently, Professor Abraham Wyner from the University of Pennsylvania came out with his modified version of James’s model. Wyner’s formula takes out all the exponents from the equation: Predicted Win % = (RS – RA) / (RS + RA). This simplification produces virtually the same predicted Win %, and was created to make it easier to do the calculations. With both models, one can determine a team’s predicted win totals down to about ± 10 wins most of the time.

The Pythagorean Expectation has been applied to many other sports, including basketball and hockey. However, one of the sports that it never seemed to forecast correctly was soccer. One reason was that “points” are used instead of “wins” and teams are also able to draw games, where each team receives 1 point. Another reason was that the various leagues around the world don’t all play the same number of games, which complicates making a universal forecasting model. However, while working with a friend of mine, Michael Berman, I believe I came across an extremely accurate model that predicts points for soccer. The formula I used directly mirrors that of Professor Wyner’s modification of James’s Pythagorean Expectation:

Points Per Game = 1.7 * (Goals Scored – Goals allowed) / Goals Scored + Goals Allowed)) + 1.35

In this article, I am going to be testing this model against the top 5 leagues in Europe over the past 10 years.


Serie A

To start out, I tested the model against the Italian Serie A. Using data from the last 10 years, I ran my forecast against every team’s actual performance. Here is what I found:

This model has a correlation coefficient is 0.9648, and a root mean square error (RMSE) of .1137 points/game, or 4.32 points over a season. What this means is that this model can predict a Serie A team’s success to within 8.64 points about 95% of the time.

La Liga

We then performed the same steps upon the past 10 years of La Liga data. Here’s what the top division of Spain gave us:

La Liga had a correlation coefficient of 0.9589, and an RMSE of .1276 points/game, or 4.85 per season. This forecasts a La Liga team’s success to within 9.7 points nearly every time. Even then, La Liga was actually the least accurate of the 5 leagues we tested.

EPL

As for the English Premier League, we were able to gather data from the past 24 years, and we once again received very encouraging feedback.

In this case, the correlation coefficient came out to .9546, and the RMSE was .1226 points/game, or 4.66 per season. Therefore, the model effectively predicted final points down to within 9.22 points 95% of the time.

Bundesliga

The Bundesliga was the only league we studied that had 34 games as opposed to the typical 38 played in other leagues. However, because our model operates in points per game, this was no problem.

In fact, our prediction for this league was one of the most accurate, with a correlation coefficient of .9547, and an RMSE of .1232 points/game, or 4.19 points per season. This mean that 95% of the time, we correctly predicted a German team’s final points within just 8.38 points.

Ligue 1

The final league we looked at was Ligue 1, the French top division.

Ligue 1 produced a correlation coefficient of .9508, and an RMSE of just .1145 points/game, or 4.35 per season. This means that for 95% of the time, our predicted values were within 8.7 points of the actual results.


This is not only an accurate Pythagorean model, but it is also very flexible, as we saw by running it through various leagues. This model can also be used mid-season to see whether a team is underperforming or overperforming their expected points per game, and that can help to predict whether they will improve or worsen in the latter part of a season. As I mentioned earlier, the baseball pythagorean expectation varied usually about 10 games. With this model, an interval of around 8.5 points is just under 3 wins over the total season, and that comes with 95% precision.

Up until now the most accurate model we saw had an RMSE of 4.7 pts/season (ours is around 4.25 on average), and that model only worked for leagues with 38 games. In addition to this, it could only be used after all games had been played. So, while creating the most accurate “pythagorean model” for soccer, we also developed a tool that can be used to figure! out what teams have been the “luckiest and unluckiest” given their performances, and also forecast how a team will perform for the remainder of the season (using the assumption that a team will regress towards their expected points per game value).

It will be interesting to put this up to the test in the upcoming 2017-18 seasons, and we expect to find high accuracy all around the world. While this model isn’t perfect, it’s very close to it.


Authors: Nikhil Mehta, Michael Berman